Blog
February 9, 2022
Avoid Truck Rolls with Tigo’s EI Software


How much does O&M cost?

For starters, Figure 1 shows estimates from Sunrun 2021 so it’s very relevant nationwide and recent. Their estimate is that operation is approximately 18% of the cost of a solar installation. I know solar has amazing benefits over typically 25-year lifetimes and extremely low O&M costs. However, there are some; it's not purely putting the modules and everything up there and not worrying about a thing. The costs are fairly significant when you tally them up over that 25-year lifespan.
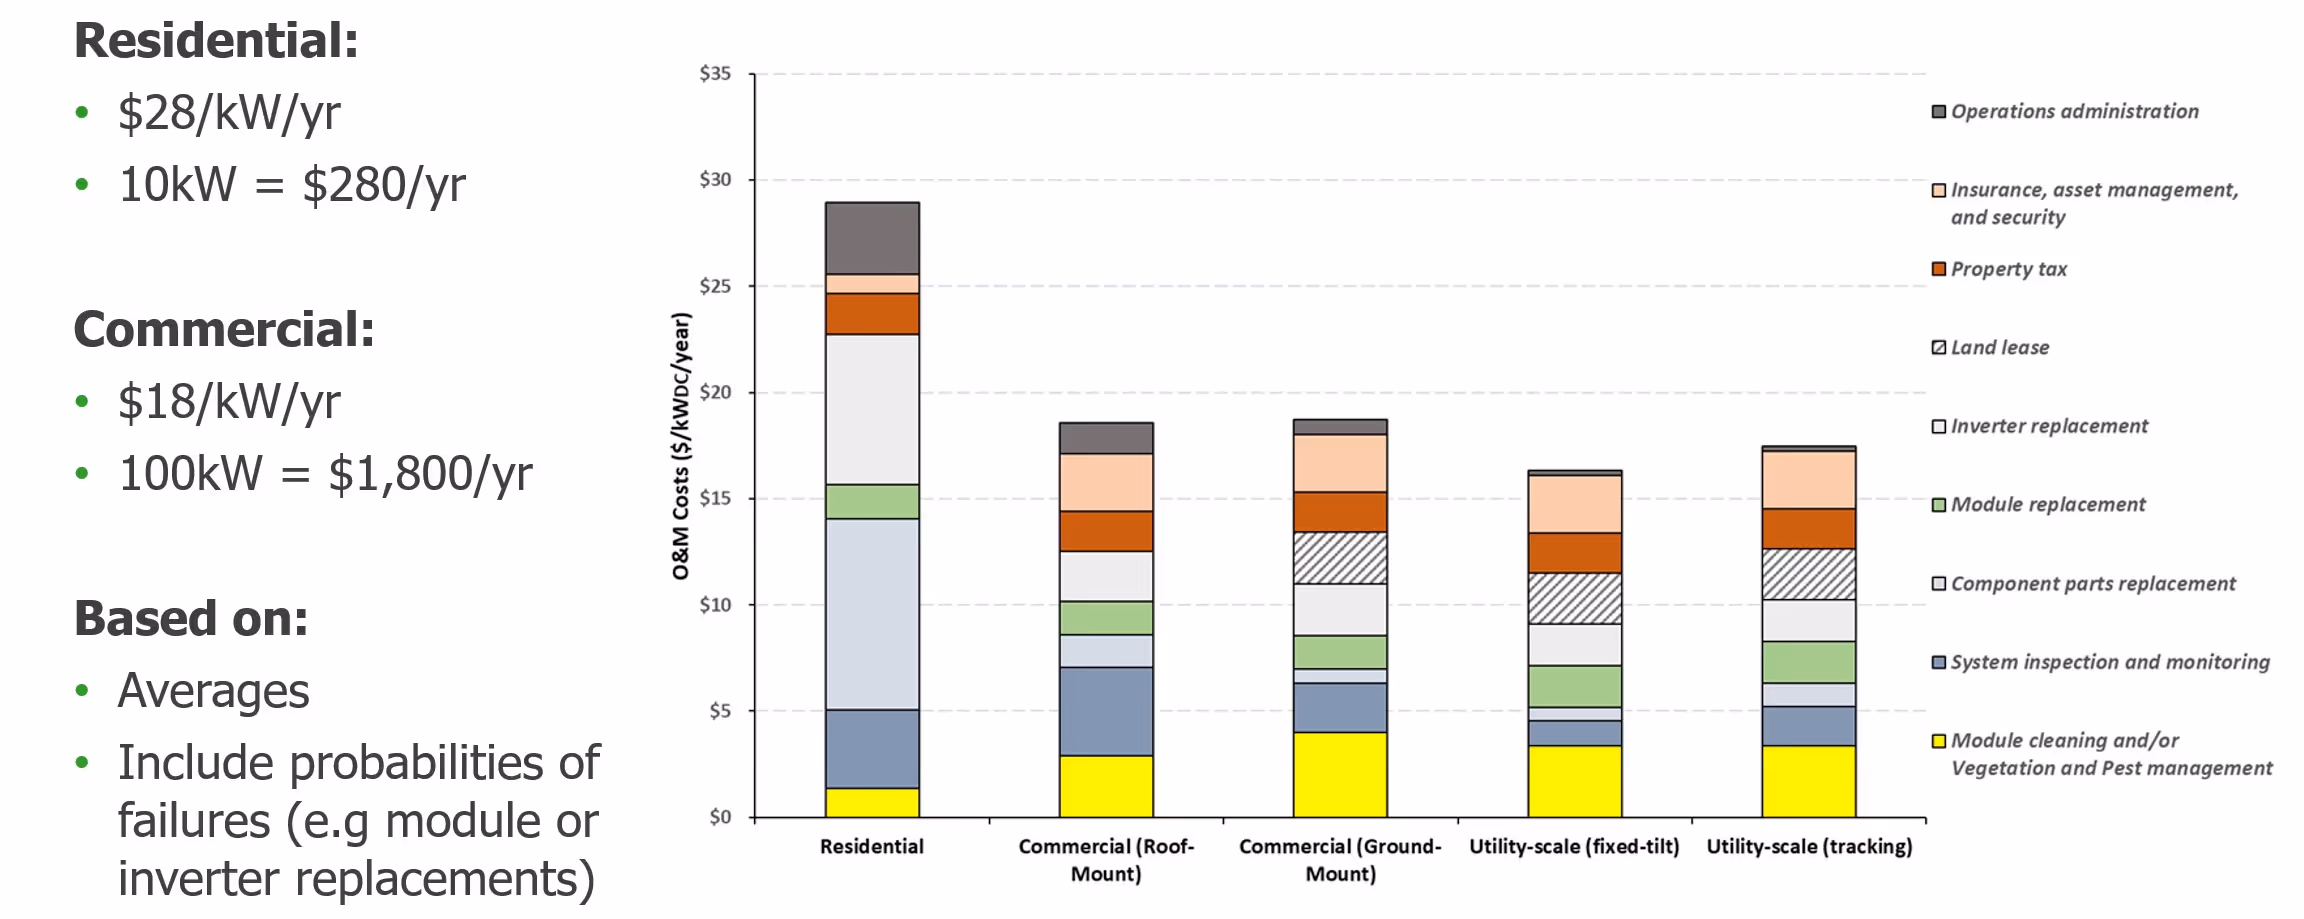
So, this is super high level (see Figure 2) and there's a really good study done by NREL, the National Renewable Energy Laboratory, here in the United States. If you want all the nitty gritty details about this, you can dig into it. They've done extensive studies on failure rates, module degradation, inverter issues, you name it, and tallied up all the costs.
What they estimate is that for residential systems, the O&M costs from solar are around $28 per kilowatt per year. What that means is on a 10-kilowatt system, you're looking at about $280 per year. That may sound a little high but realize that this is over a 25-year project lifetime, and it is not just for one site, it's for an entire basket of sites where you get some lemons, some great ones. So, they've done all of the probabilistic monitoring, the failure, curves, et cetera, and bundled it into this one analysis. And you can see the breakdown in Figure 2.
So residential costs I mentioned is around $28 per kilowatt per year. Commercial is less, at $18 per kilowatt per year. And what that means for a hundred-kilowatt site, so say a very large commercial rooftop, you're looking at around $1,800. So, it was still fairly significant. And again, I want to stress that doesn't mean that you're spending $1,800 a year. That means on average companies probably ought to be allocating that much because if a big inverter replacement or a big bunch of module repairs come, even if it's at year 10 or 15, those might all come at once. But that $1,800 is what it looks like when it's amortized across the entire life.
So hopefully that sets some grounding for our discussion today, as I get into the cost numbers in the specific examples for how we can save you money, I'm going to use these $28 per kilowatt as references as percentages for how much off those we can save you. So, keep those in mind.
Truck rolls
The area of what I want to focus on and how our monitoring can benefit is regarding truck rolls. The fewer times that you need to send a technician out to the site, the more you're going to save.
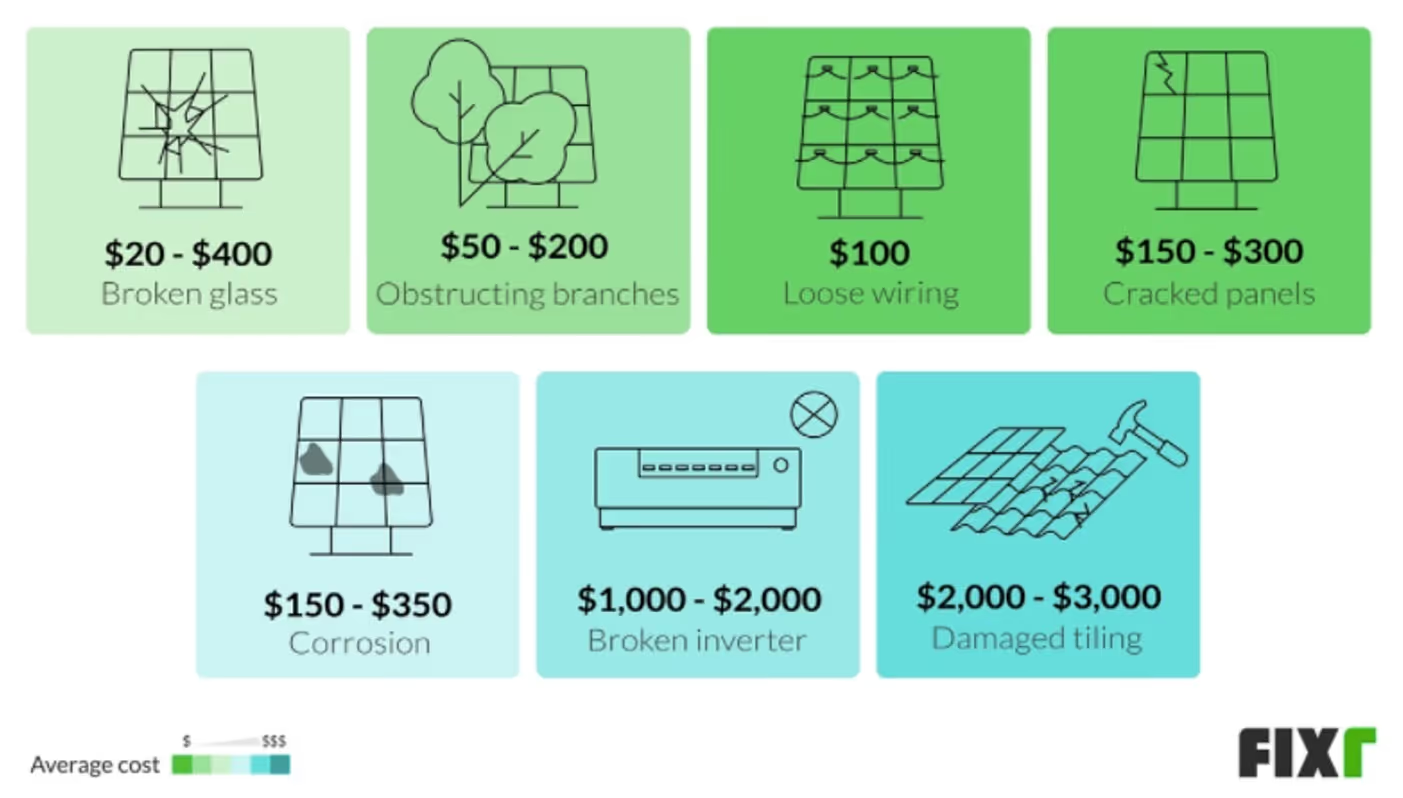
So, Figure 3 shows some examples of different common costs associated with truck rolls, but in general, they tend to be about $150 to $300. And a lot of this which comes from this website, was based on the residential side. Those numbers increase on the commercial side because you have a much larger area, more modules, potentially more inverters – more distance to cover.
Why monitoring is important
So, let's get into it. What if we can avoid many of these truck rolls all together.
This quote from EnergySage is great, “A solar system that is either damaged, not clean or otherwise malfunctioning will leave a trail of breadcrumbs in its energy output stats.” I think that's fantastic because what it's saying is usually, or often, you can decipher what's going on, what's potentially wrong with the site, or maybe nothing's truly wrong with this site based on what's going on with the energy output data. And the more granular the energy output data, the more accurate you're going to be at determining whether or not you actually need to roll a truck. And if you need to roll a truck, are you going to send the right person with the right tools at the right time, given the right level of urgency, et cetera.
Before we get into that in these specific examples, I want to ground the audience in what our monitoring platform is capable of because I think it's going to help connect the dots of how these truck rolls are avoided when I talk about the specific scenarios.
Energy Intelligence (EI)
We let you remotely detect and diagnose different issues that are going on in the array and that has three primary benefits.
- Increasing energy output. Basically, if we can help you maximize the uptime of your site when an issue arises, it's immediately identified and immediately remedied. More uptime is equal to more energy for your end customers or, in some cases, you.
- Minimizing O&M costs. That's all about reducing those truck rolls. So, by identifying module level issues, you can pinpoint the issues remotely.
- Enhance the customer experience.
EI Stack
We're able to do this with what we call the Energy Intelligence “Stack”. This is the stack of which we operate for our platform, not the technology stack, but the stack in terms of visibility for what you and your customers are able to see. So, specifically for you as an installer or installers.
- You have fleet management: that's a view of all of your fleets – all of your different installations in one spot through one platform as long as it's connected with Tigo.
- Then you get system level view: this includes the installation, the inverter, could be the energy meter – all the different modules.
- Then module level visibility, of course.
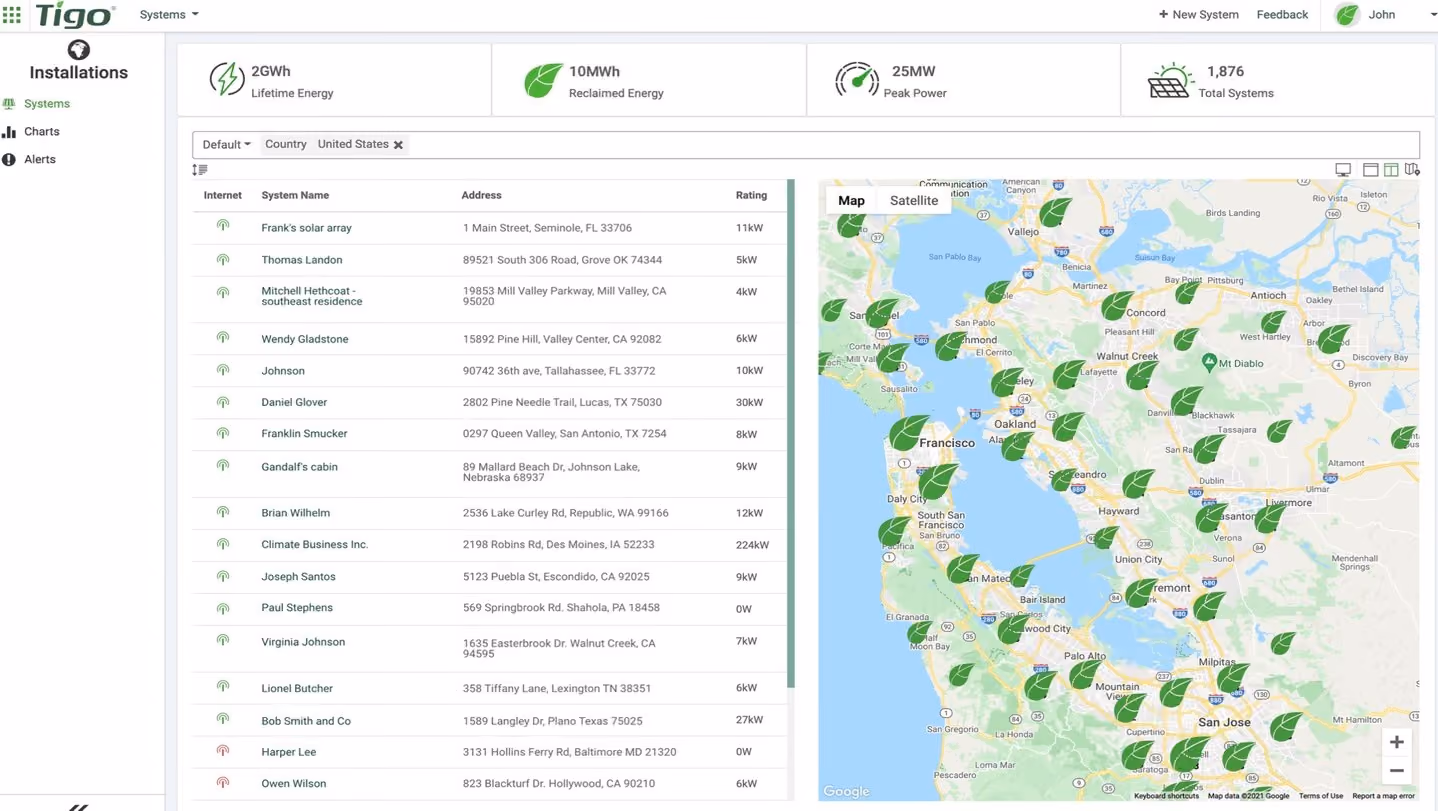
Fleetwide. This is a screenshot (see Figure 4) of what it might look like in the Bay Area if you operated a whole fleet of different systems. You can see the name of the system, the address, the capacity, and click into any one of those and get more details. So that's really cool.
You're also able to filter by any number of metrics that are included in the system, including the size the technology used, et cetera. So, you have all of your systems in one central database. Very cool for your own operational needs and also very cool from a marketing standpoint, because we have this really cool kiosk mode that'll flip through your different installations. So that's the top-level, fleet-wide view.
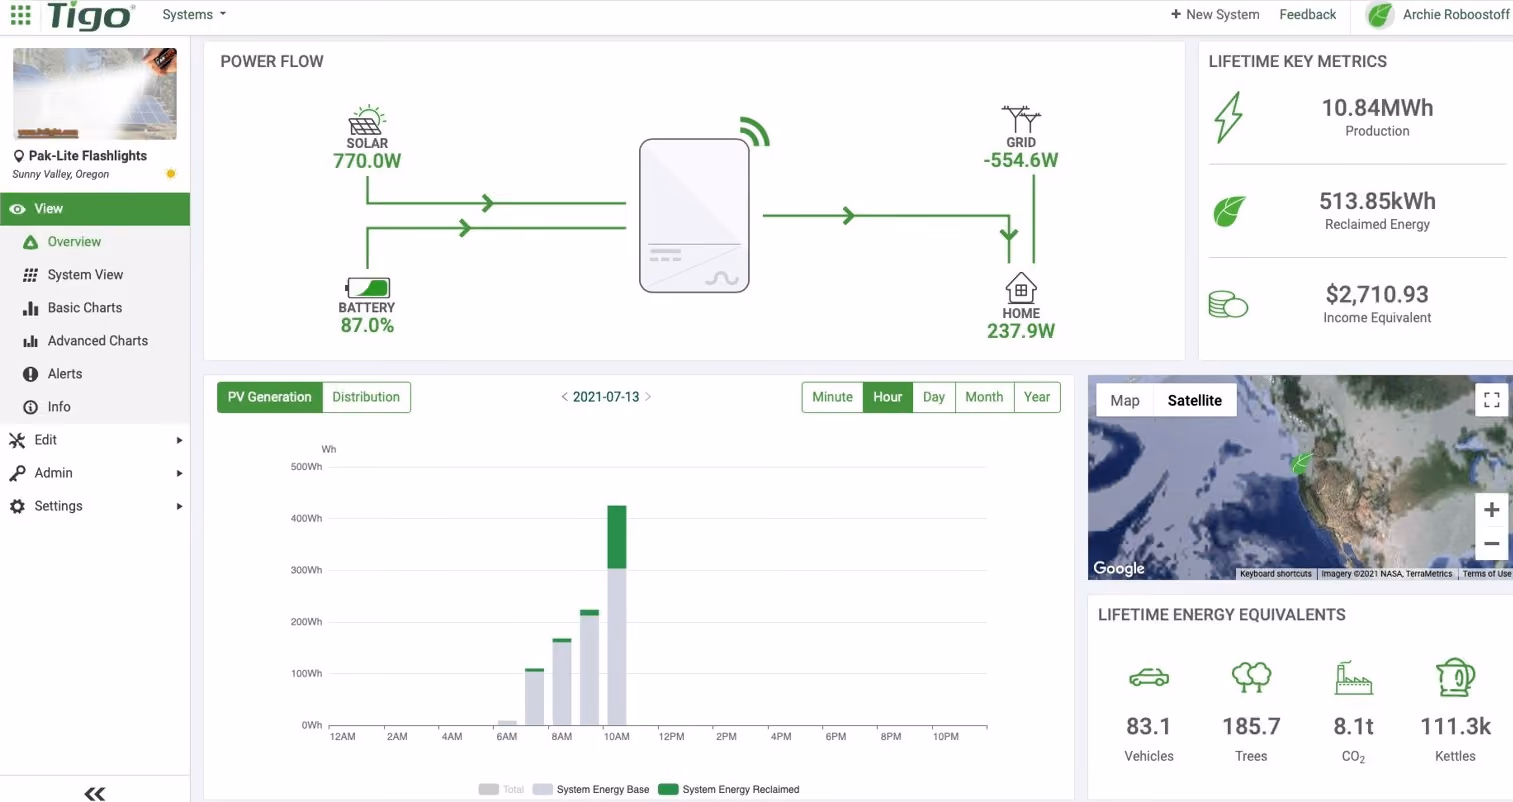
Then we get into the system view. So, this is the view that you and your customers can see. In the top panel (see Figure 5), you see what's coming in off the modules, coming into an inverter, if they've connected a battery, if they've connected a home energy meter, or anything else. You can see real time flow.
All of those can be connected to our Cloud Connect Advanced. So, our customers can see real time what's going on with each component, as well as any of the lifetime metrics.
Then I want to draw your attention to the bottom graph. That bar graph is showing hourly output data and the green line that stacked on top of that bar graph is the additional energy from our Reclaimed Energy feature from our optimizers.
So as far as I know, we are the only ones that actually show you the additional output that our optimizers are delivering for you and for your customers. That's good because then you can calculate the ROI or the benefit from the optimizers for your customers.
So, we give you this complete view, and this is the system level. Of course, this is showing the real time data – you're able to go back and see historical data by the hour, the week, or by the month. So super powerful tool there.
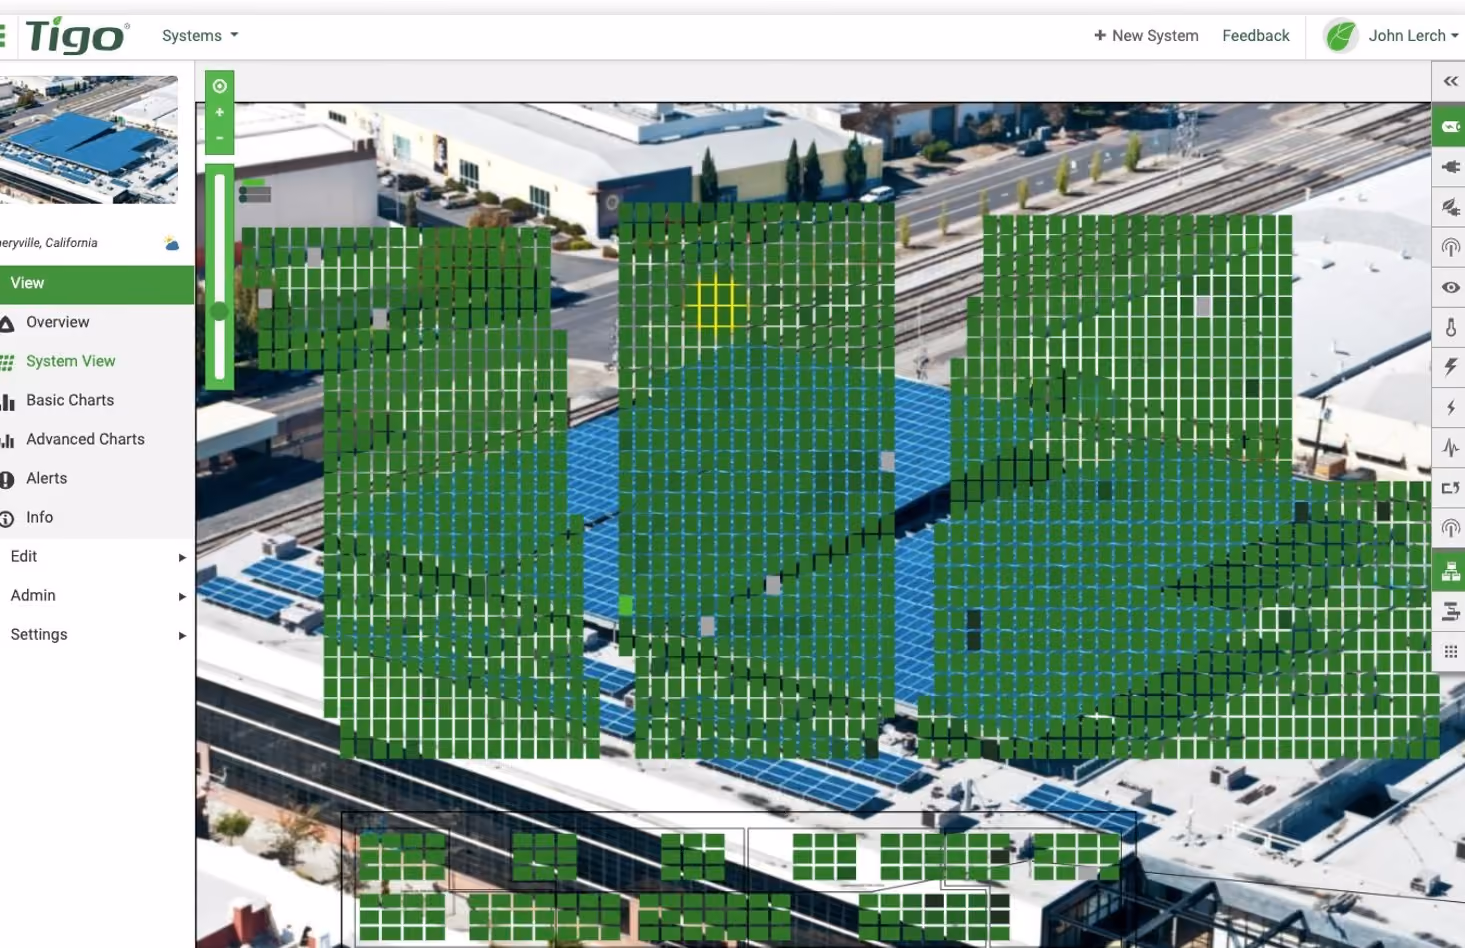
And then of course we get the module level. If you've connected more components, you get to see all of those components in an electrical, essentially a line diagram, and you also get to see them in a full layout. This could be overlayed exactly as the modules are shown or maybe a little different than in Figure 6, but you can see the performance of all of these modules.
If you actually hover your mouse over them and click it, you can see the performance of each individual module. That includes what it is doing real time, and you can even go back and see how they’ve trended. What's really cool is in an instant, you can start to identify potential areas where the site might need work or there might be issues.
In addition to just the module level, we do have very specific, actionable alerts. So, you can configure these – you can sleep them as needed, set it up however you want, but you get alerted for how your systems are performing. So, you get notified if there's a performance issue, if there's a safety issue, and it can identify the specific component where that issue was identified. So super, super powerful especially as you extrapolate this over a whole fleet to not get surprised by potential performance issues and you certainly don't want to get surprised by safety issues.
Common customer issues
Example 1: Customer calls and asks “Why is my system under-performing?”
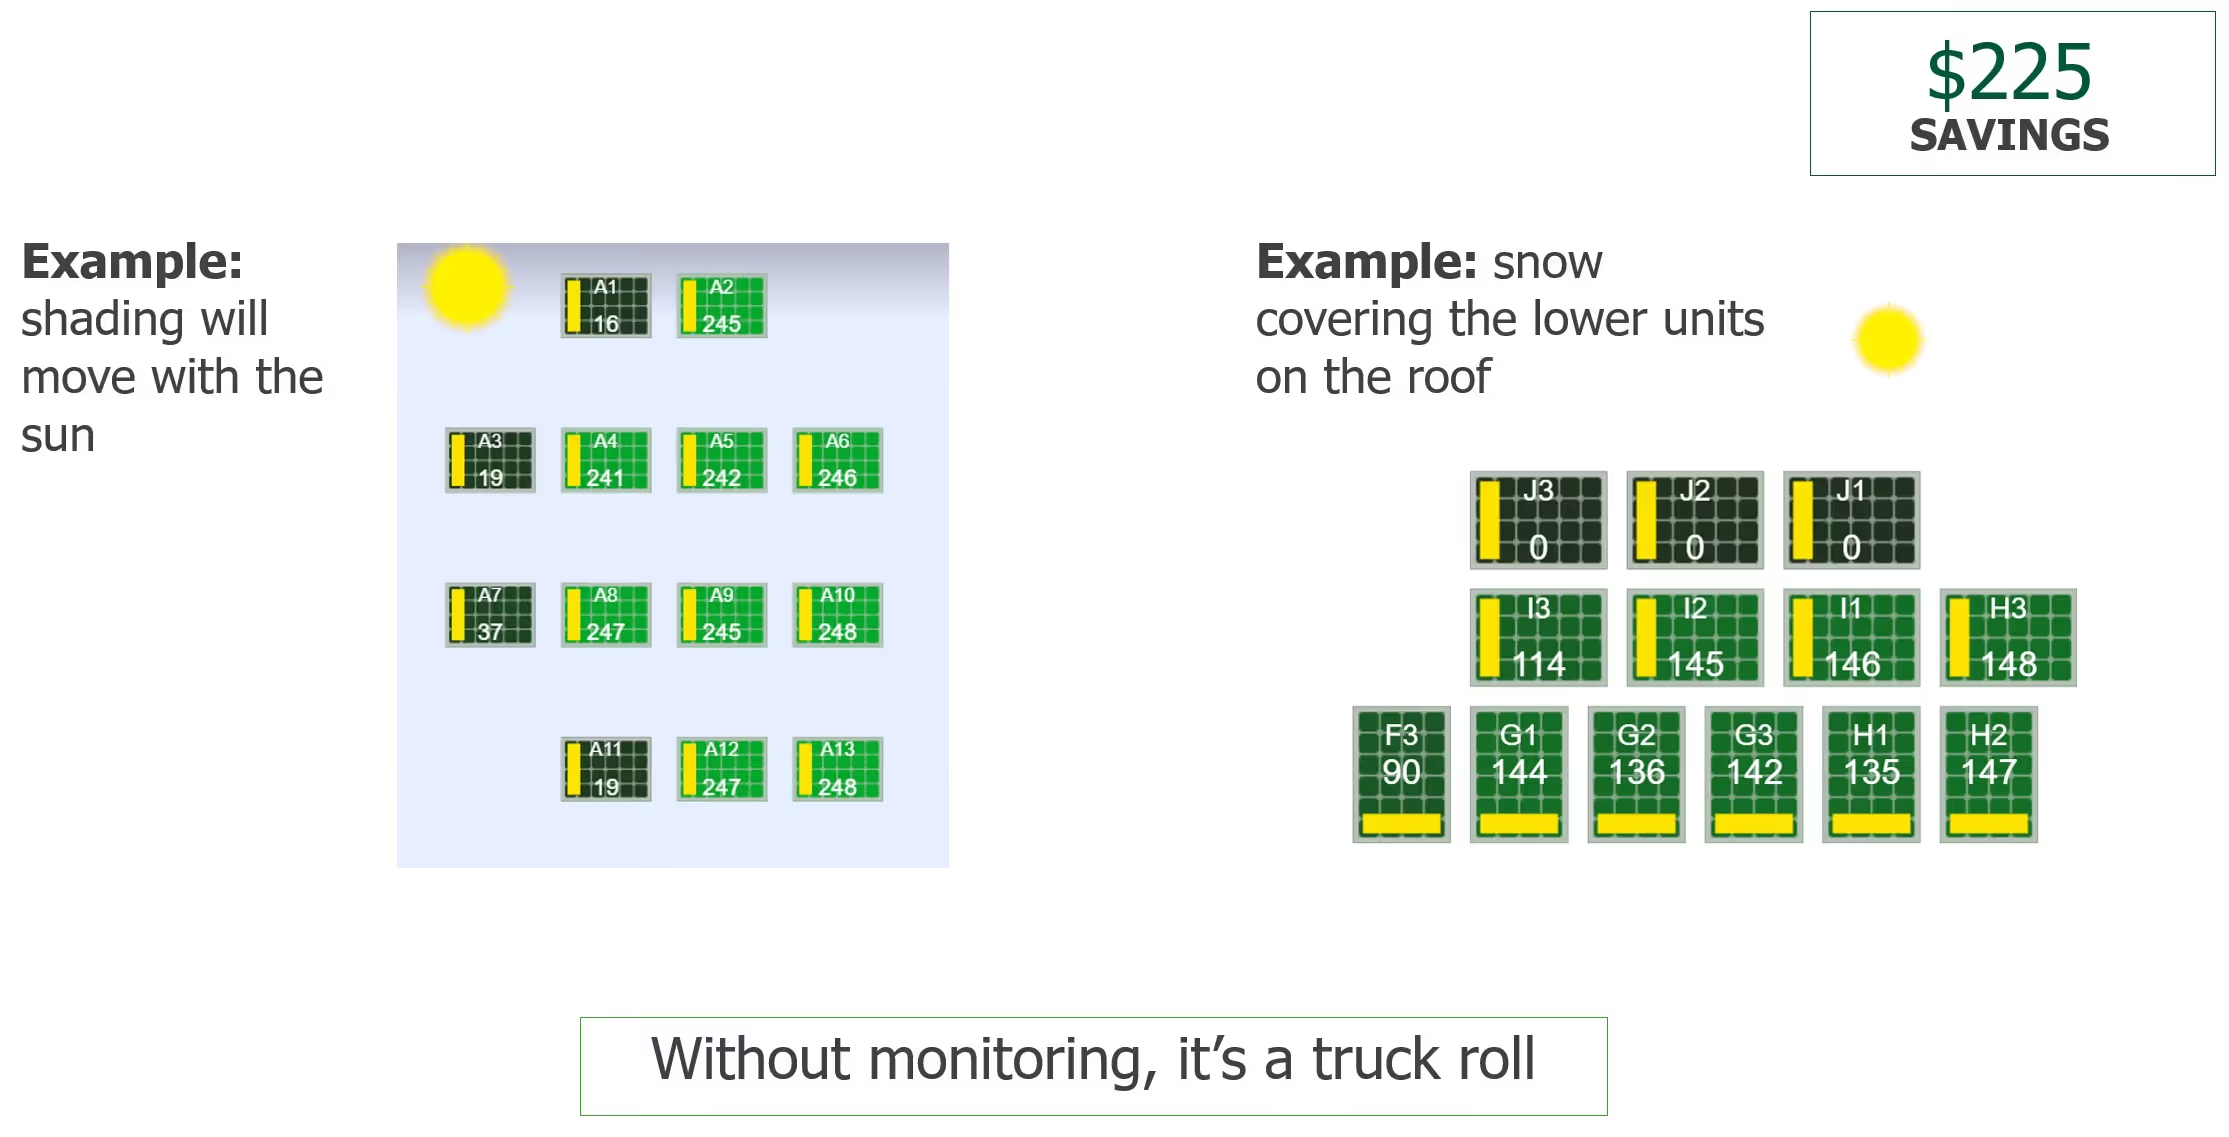
We hear about this all the time and without some module-level data – you might just have inverter level data – it might be hard to tell. With this one, which you can see on the left in Figure 7, there's shading as the sun still has to rise and meet these other modules – that's a very quick response to a customer to answer their question.
Here's another example (right side of Figure 7) where these three on the top are on the edge of a sloped roof and it snowed a few days ago. So, the customer is wondering what's going on. Well, there's snow still on those lower modules and it's preventing any sun from reaching them.
So, you can get the phone call, dial in to these specific sites and let your customer know, “Hey, you know what? That's just because the sun hasn't reached those ones yet”, or “It's likely from the recent snowstorm –there's snow blocking these ones.”
What that translates into is you've avoided having to send a technician all the way out to the site. Otherwise, you have to get a technician a truck, roll them out to the truck, they go check out the site, maybe have to talk to someone there, come back, fill out some paperwork – you saved the individual technician time and you’ve saved overhead time at the office. So, ballpark for a truck roll is $225 in savings at a residential site.
Example 2: Making multiple repairs at a commercial site
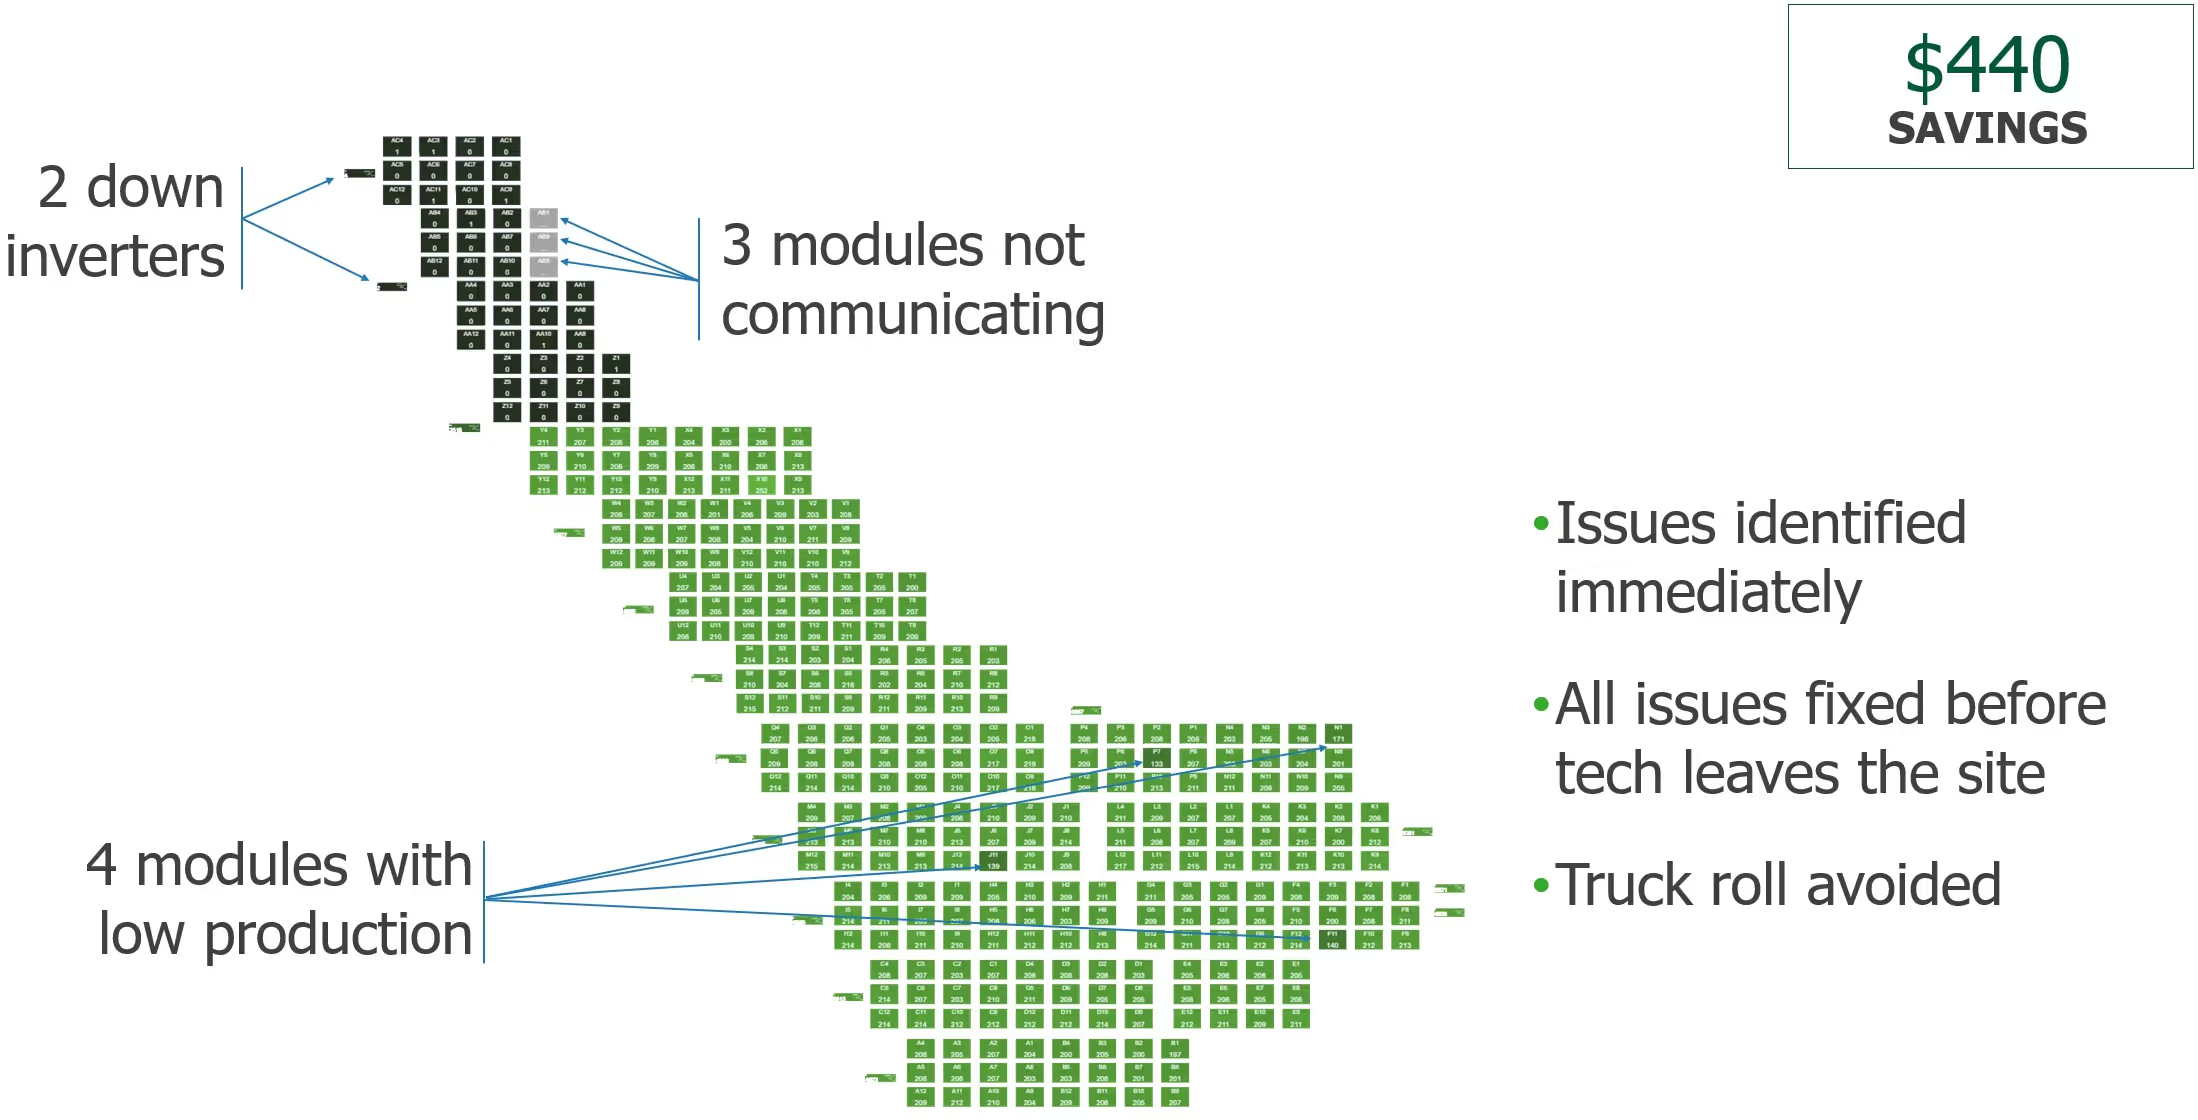
This (see Figure 8) is often something that might occur at commissioning. So, two inverters are down in this case. You can see the strings here are all black – not producing power. You can also see there's three modules (they're in gray) that are not communicating. So, something needs to be checked with those three individual ones.
If you just replaced the inverters or just troubleshooted the inverters, there might still be an issue here. And lastly, you see these four darker modules that have lower production. So those might be diode issues – there might be something covering them, there might be loose connectors, or something else, but those four ought to be checked.
The big takeaway here is that all three of these issues can be identified almost immediately by just looking at this image. That means if you have to send a tech to the site or if they've just commissioned it and they haven't even left, they can fix all three instead of maybe fixing the down inverters, going back to headquarters, getting a phone call later about something not reporting or something being down and having to send a whole extra truck and going in troubleshooting throughout these different strings. So, in this case, I'm ballparking $440 worth of savings: more time onsite, more troubleshooting, probably even more paperwork on the backend.
Example 3: Know exactly which modules need service
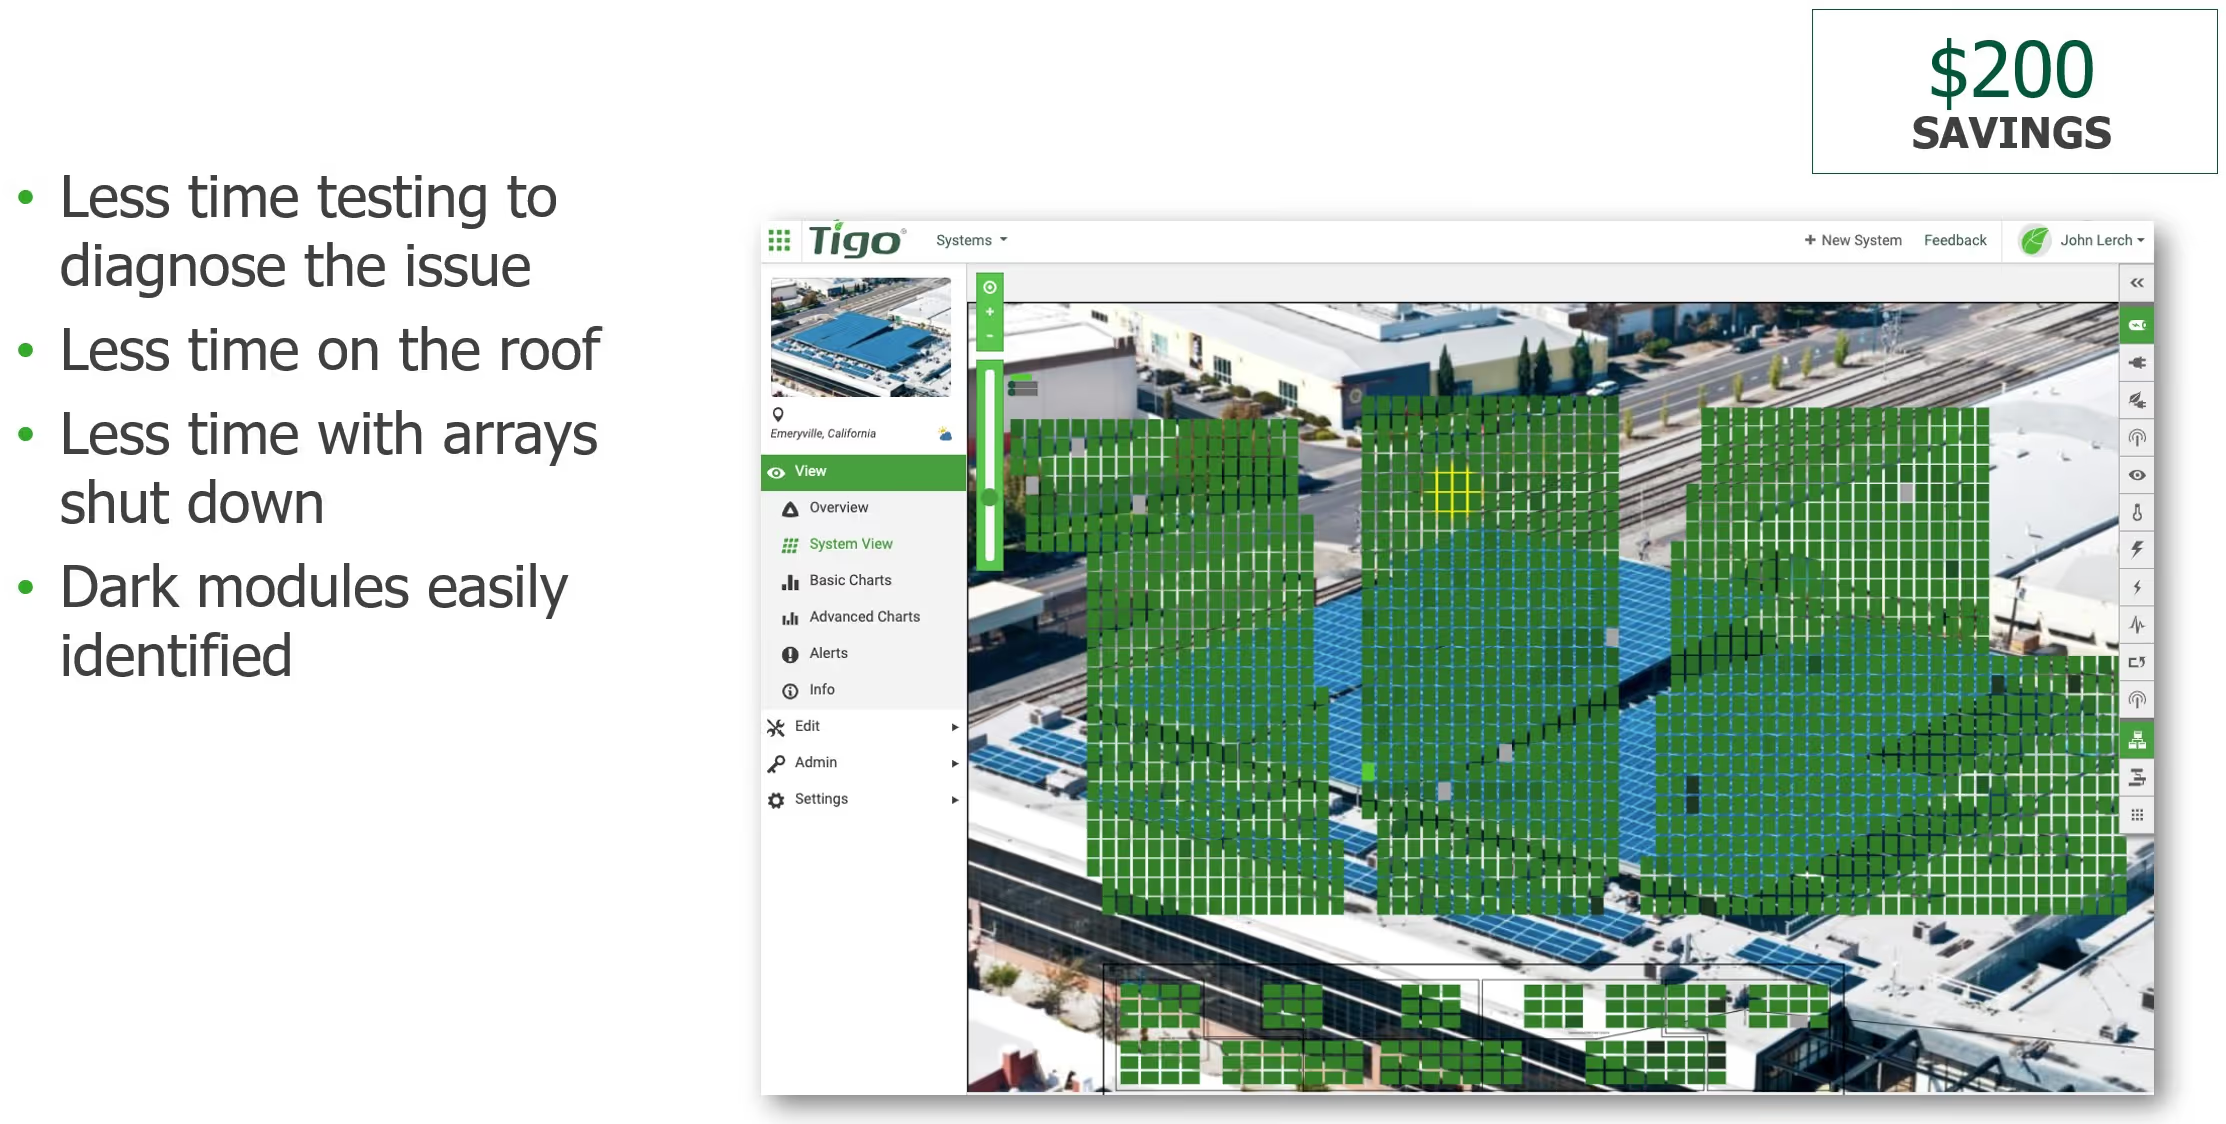
We already highlighted some of this view and I teased earlier that on a glance, you can identify some of the module-level issues. In Figure 9, there are a few gray modules scattered across the top left, across the middle, and the right. What this means, because this is an accurate layout of the entire system, is you know exactly which module that needs to be either repaired or replaced right away.
That means less time on the roof for your technicians, less time potentially having to shut down the array, which of course is costing your customers money, because you've been able to identify them super quickly. So, if your technicians can spend less time on the roof, we’ll ballpark that $200in savings.
I can easily see this being way greater than $200 of savings as you're testing different ones, testing different connections, et cetera. That's all time that a technician could be better purpose to say installing new sites or something else.
Example 4: Batching visits
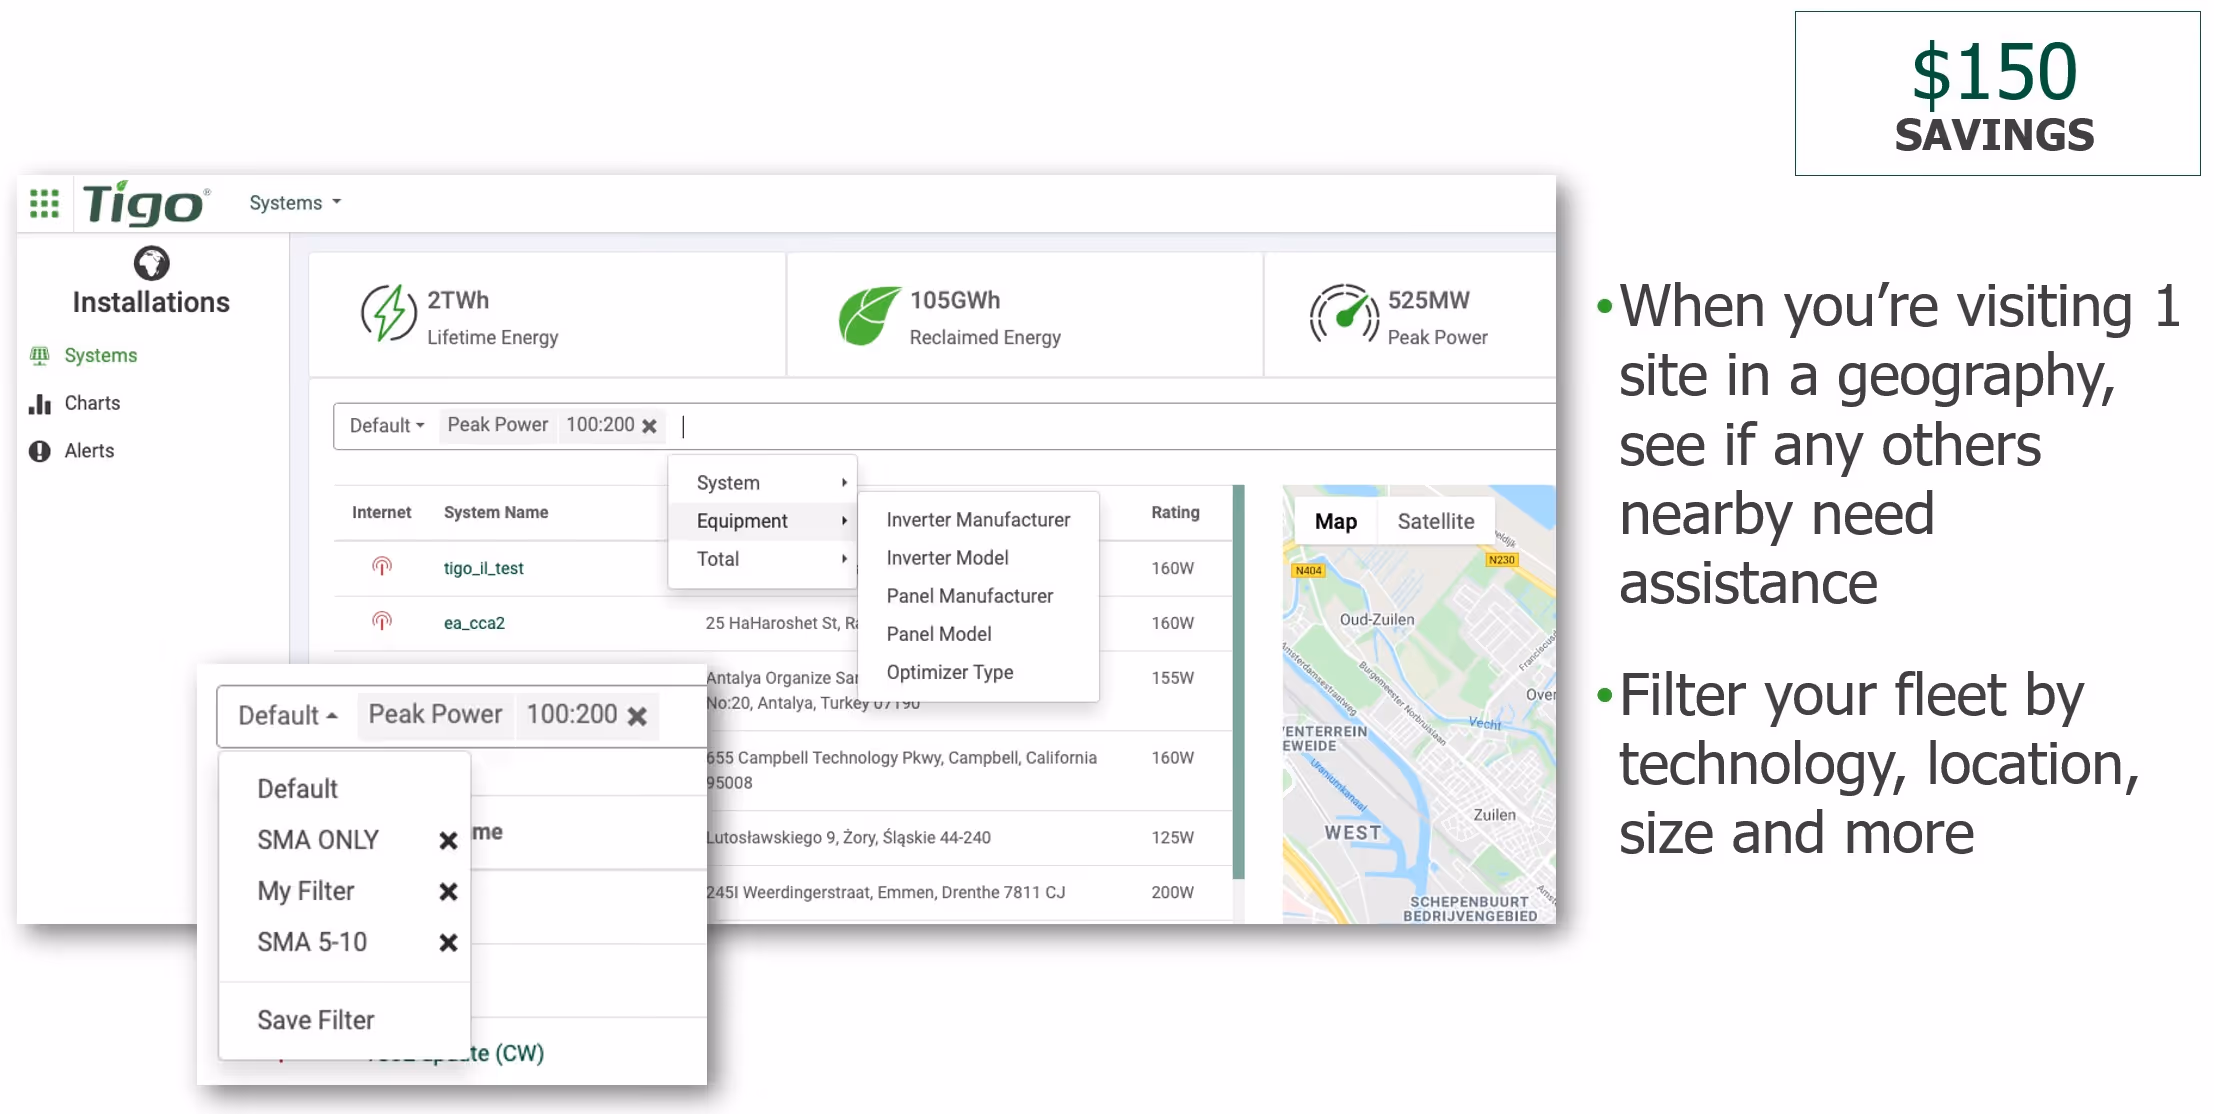
I love this one because it's a little more abstract. It's a little different than the individual, site-specific stuff. This is when you're looking at those different sites, like the examples that I just went through, and you know that you need to get to a few sites in your region. Instead of going to one ad hoc and coming back, maybe you've looked at two or three different sites and said, “You know what, we need to do something about these. They're not super urgent, but we can schedule a technician to go do that tomorrow.” And they'll be able to go do two at once. So instead of going to one because it seems super urgent and then coming back, and then another, and then coming back, you go do two at once. Well, that again, just saves that round trip car time-savings – ballpark it at $150.
Example 5: Performance decline due to diode outage
And so we've talked a lot about avoiding truck rolls and the O&M reduction. So, the benefits to you as an installer that can commonly happen is there might be performance issues causing decline in output, and it can really end up saving your customers a significant amount of money.
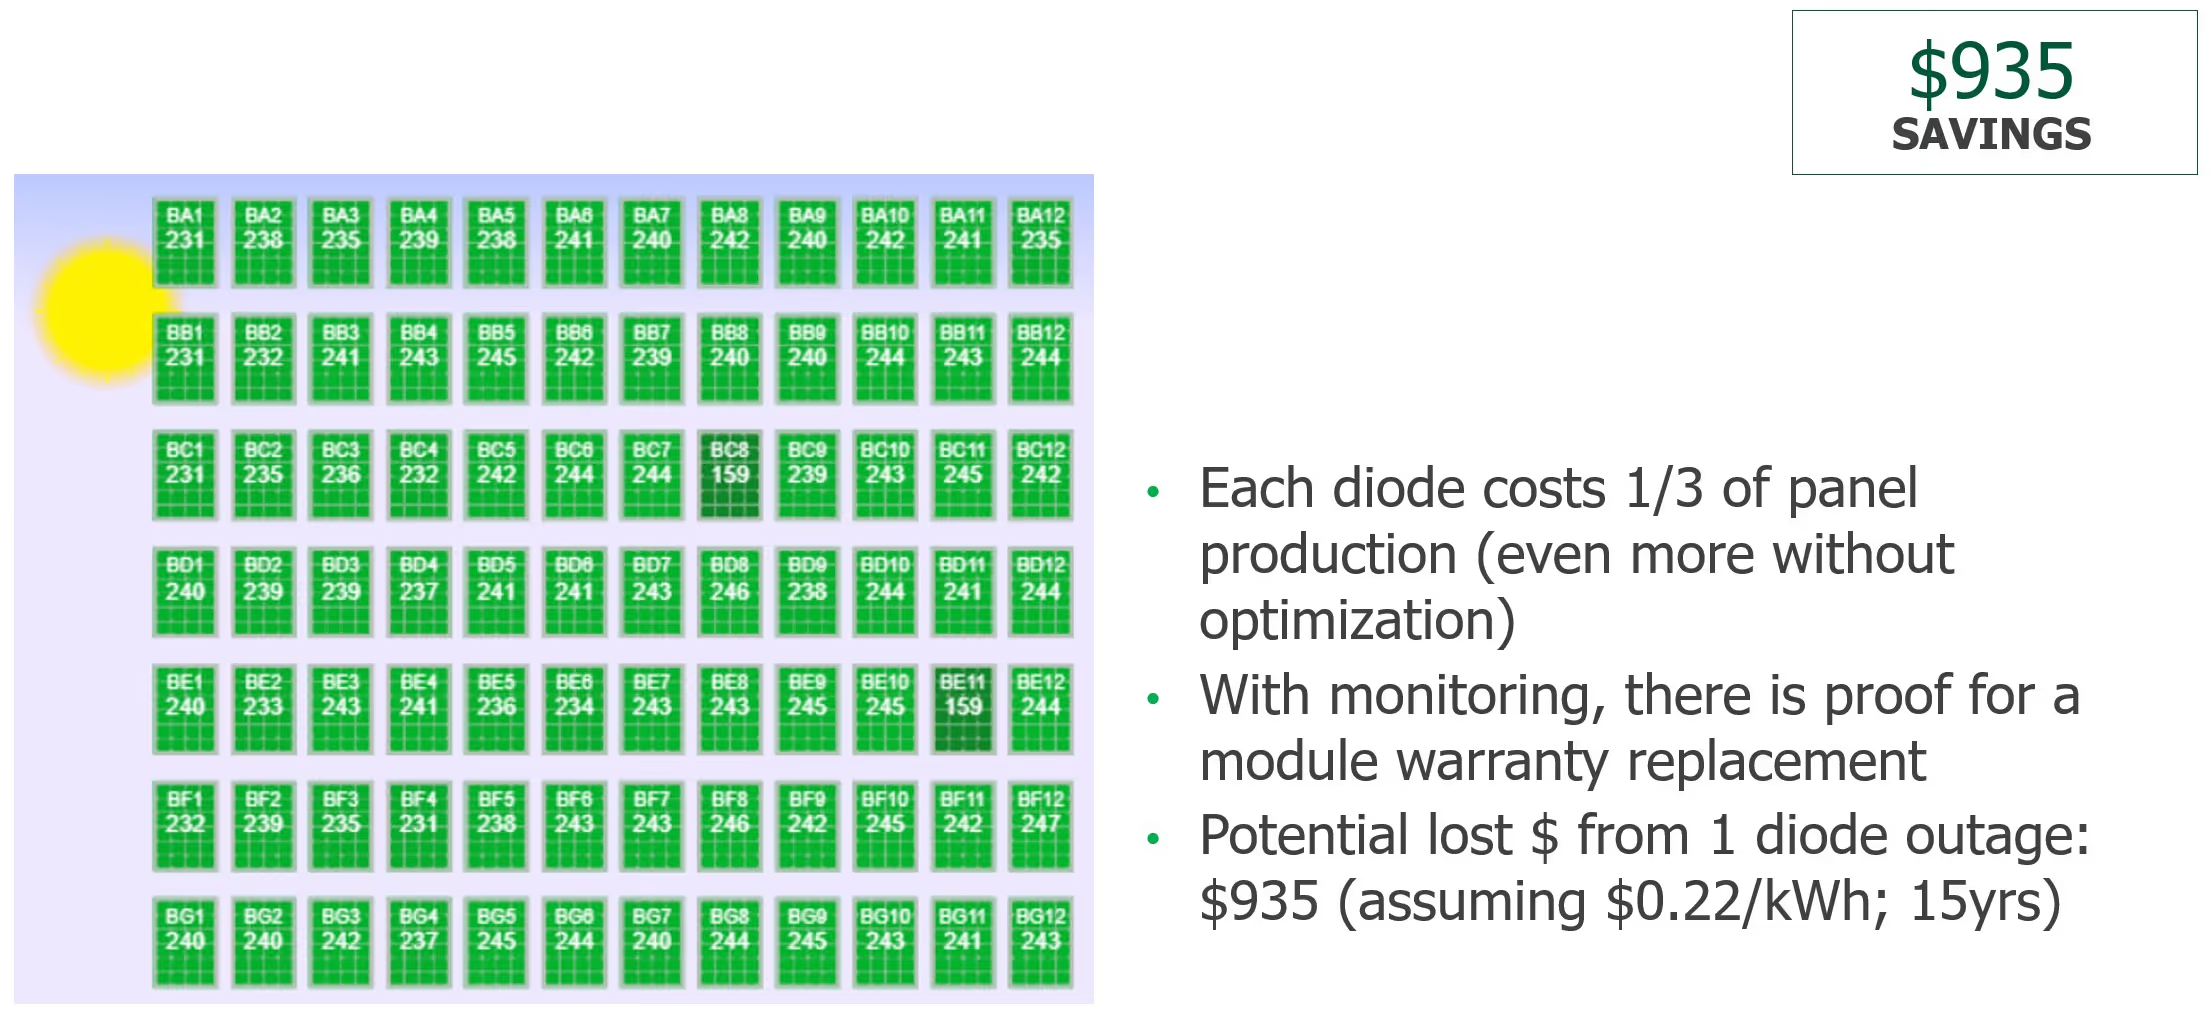
Let's use a common example. There's a diode out. Typical diode outage reduces the output of about one third of the panel and likely it’s even more without optimization. But for being conservative, let's assume one third of that panel or module is not producing energy. If you don't have module-level monitoring, that might go completely unnoticed for 15 even 25 years – it might just be a slight reduction in output that no one really realizes. With monitoring the second that system is commissioned and brought live, you're going to get a view like what you're seeing in Figure 11. You can see super clearly there are two modules in here (the darker green ones) where the production is lower than you would expect for brand new array or brand-new modules. And to quantify it, I know there's two in this picture, but just one diode outage – and not even over the whole 25 years, just assume over 15 years at $0.22 a kilowatt hour (about a residential rate) – that’s $935. If it's over the full 25 years, you're looking at $1,500 or so dollars. That's a significant amount of money that really adds up over time.
Summary
So, I've talked a lot about it, but sometimes nothing beats getting your hands on the real deal. You can demo this on a live site, check out our demo here. It’s on a live site in California, it’s a residential one, so check it out.
I'll also note that we are available for download in the app store. You can get this on Google Play, you can get it in the Apple App Store as well. All of this information, I showed a ton of screenshots from kind of a desktop view, of course is available in the palm of your hand as well. It's also the same exact app for you to be able to commission this.
We have a ton of fantastic resources for you online. We've spun up a whole Community where you can engage with other Tigo folks, other folks using our products, as well as experts from our Customer Success Team. Everyone's on there talking about it.
So, if you have questions or you want to get involved, checkout our Community here. To leave a comment on this blog, click here. And then lastly, if you want more information about Tigo, we have a huge list of case studies, data sheets, additional information, certification, whatever you need, you can find it here on our downloads page.
All of our common questions and everything else is on our support site and if you want to get in touch with someone from our sales team click here.
